
Calculating drag, fuel burn, and range for yachts under power is a complex process, one which often turns out wrong in the real world. We are not sure what other folks do, but we use a combination of science, model testing, real world results, and various software suites, mixed with a healthy dose of gut instinct.
This amalgamation of information includes several data sets which need to be viewed with a jaundiced eye. Relying on one or two of these would be dangerous. But with enough information from various sources sometimes a pattern emerges in which one can have confidence. Take towing tank models for example. Because of scale effects, instrumentation calibration, and a host of other factors, interpreting tank tests is notoriously difficult. Many a designer has gone wrong in this arena. Getting reliable data requires sophisticated tank operators who are familiar with the type of design they are testing, and large models: a minimum of 1/10th scale.
CFD can be helpful for projecting the impact of design variations, but typically only after being calibrated with accurate tank test or real world data.
One of the better sources of information is a fuel burn report based on a vessel’s voyage. However, variations in ambient conditions, vessel speed, and accuracy of reported fuel consumption cloud the results. The only really accurate way to use fuel burn data is with smooth water runs at varying speeds, in two directions and then averaged, using a long enough distance that day tank measurements can be accurately interpreted. The day tank sounding must be done in absolutely calm conditions.
One of the data sets we tend to like is built up from a series of voyages. Yes, the accuracy will vary from boat to boat, and we never really know the added fuel burn from hydraulic, electrical demand, wind, and wave, but if time after time the numbers come out in a certain range, then we feel we can use them in a generalized sense.
Then there are hundreds of large scale tank model test series which various software use or make available. Obviously it is important to use data sets that relate to your hull form.
Which brings us to the first graph. This is for the FPB 78, and is based on four different model series. The results are then plotted together to see whether or not they agree, and if they diverge, where and by how much. The closer the output of the different models, the more confidence one can have in what they tell you. What you are looking at is a warm fuzzy feeling, with one caveat: there are certain assumptions not yet fully vetted, such as final displacement. We have a degree of confidence in the basic boat weights, at least at this stage we know the ballpark in which the game is being played. But with nearly 7,000 gallons of tank capacity, which is not intended to ever be used all at once, there exists the possibility for wide fluctuations in drag data.
We should add that the first data set is for smooth water, clean bottom, no wind.

Once a baseline drag set is developed, the next step is to figure out how to get the power into the water to overcome the resistance and achieve targeted cruising speed. As there are wide variations in prop efficiency, affected by water flow to the prop, wake fraction analysis, prop shaft angle to water flow, to name just a few factors, it is easy to go astray in this area. In the end, your prop efficiency calculations are tempered with deductions for losses in the transmission, each bearing, and in this case, the CV axles. If you are prudent, you will also toss in some points as a fudge factor.
Now it gets tricky. One of the major contributors to efficiency, or lack thereof, is the disk area ratio (DAR) which tells you the percentage of the circle filled by the propeller blades. Anything more than the minimum required to get the job done is extra drag in smooth water. But a minimum DAR prop in turbulent water flow will cavitate, so we need to throw added area at it, which in the end, actually improves overall performance since most voyaging is done in less than optimal sea states.
However, too much DAR and the prop will overload the engine when you are caught in heavy weather, especially upwind. You need to roll the dice, see how it works out, and be prepared for a game of propeller changing.
The next series of graphs deals with this subject starting with the one above. We are looking here at engine load percentage compared to boat speed in calm conditions.
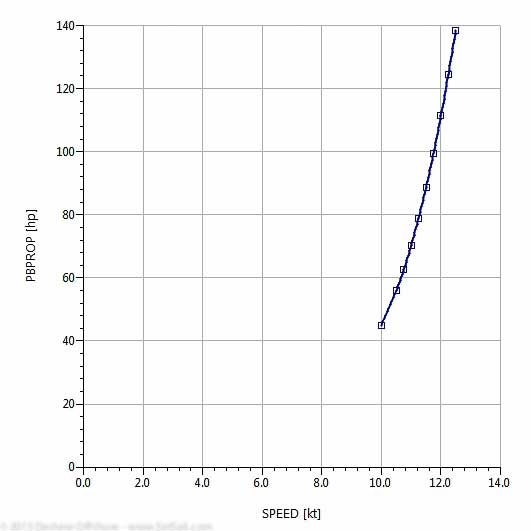
Using the same data set here is speed vs horsepower.

Now we need to look at available power vs windage as the breeze picks up. We want to see where the prop begins to slip, allowing speed to bleed so that we minimize overloading as wind resistance builds. The RPM vs load % is shown for 13, 24, 37, and 51 knots of wind. Note that the 100% engine load point is reached above 1900 RPM in all cases, the crankshaft speed where the engine is capable of delivering full power.

Then we need to cross check boat speed compared to engine loading. What we see here in combination with the preceding graph is another example of prop slip, allowing the engine to work without being overloaded. Take the ten knot number and then check the loading percentage against the top red data line which represents the theoretical load in 51 knots of wind. Engine load shows up as 60%.
None of this has an allowance for rough water drag, which can be substantial, and with some designs even more than the delta from windage. However, the FPBs are slippery enough that the rough water drag is typically not that big a deal, so we think this gives us sufficient margin.
The more the engine loading and propeller choice is oriented toward the normal cruising speed, the more efficient the boat will be a majority of the time. But we feel you need to leave some efficiency behind so that there is reserve for the adverse scenario.
Here is where we come back to those recent posts on FPB 64 ocean passages. Three out of the four made very good use out of the reserve built into the system to help them maintain their average cruise speed in spite of sub-optimal drag scenarios.
Which brings us to the preliminary range at various speeds for our new FPB 78 Dream Machine.
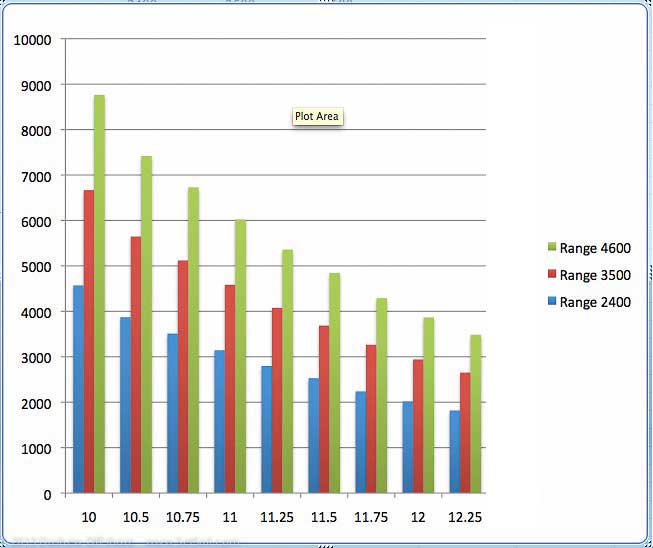
The graph above for the FPB 78 is based on a 55 ton/121,000 pound displacement, smooth water, without an allowance for hydraulic or electrical power loads. Range is on the left side in nautical miles, speeds are across the bottom ranging from 10 to 12.25 knots. Fuel capacity is shown in US gallons at three fuel tank levels, with the latter, 4,600 gallons/17,400 liters representing being filled. One of the points we want to make is that it is not necessary to load the boat with fuel to have a reasonable range. Even with the tanks half full, you have quite a long range when backed off to 10.5/10.75 knots.
Now, we all know that there are going to be additional loads for various items previously discussed. So, when doing passage planning we’d drop these numbers by 10 to 15 percent to allow for Murphy’s adverse conditions law to take effect.
You might be asking yourself, why have so much tank capacity if you can slow down a touch and extend the range? There are a number of reasons:
- Having the option of going fast, if necessary, gives us a variety of weather tactics options we would otherwise not have.
- Extra speed generally pays comfort dividends in three main ways. First, the gyroscopic stabilization that comes with speed is powerful force towards mitigating motion. Then, the work the stabilizer fins can do is a function of velocity squared. Combine the gyroscopic effect with the stabilizer increased force generation, and with our FPB even a quarter of a knot increase in boat speed will make a noticeable difference in comfort.
- We might want to head for Puerto Monte in Chile once sea trials are complete. Assuming ice forces us above the great circle route, this is a distance from New Zealand of about 5000NM +/-. We can do that at 11 knots with enough fuel to keep cruising for a season or more once we get there. Or maybe we have a hunkering for Kodiak, and are not particularly interested in stopping in Hawaii. We can top off in American Samoa where the diesel is the least expensive in the Pacific basin, then head direct to Kodiak, cruise the Kenai Coast of Alaska, and not need fuel again until we make Washington at the end of the summer.
- Then there is simply the comfort of having enough fuel to cruise for a long, long time if the world turns to garbage.
We could go on for hours on this subject, but we are close to our metal cutting deadline and there is lots still to be done. We have been finalizing systems, plumbing runs, the locations of various bits of gear, while fine tuning engine room and workshop details (and wait till you see what we’ve got there).
OK, time to get back to work.
Posted by Steve Dashew (July 11, 2013)
July 12th, 2013 at 3:51 am
Where on your FPB78 is maximum waterline beam? Is this any different to other models? I personally like 115 shape the best
July 12th, 2013 at 7:18 am
Maximum beam on the FPB waterline is about 43% of the length forward from the stern.
July 13th, 2013 at 12:53 pm
It’s interesting to compare your numbers with those of the new Nordhavn 120:
http://www.nordhavn.com/models/120/delivery/route.php
If I’m reading it right, they get about the same range at 11 knots, but use almost 4x as much fuel.
July 14th, 2013 at 1:44 pm
Not being familiar with the Nordhavn’s numbers it is hard to comment. But we would expect to be significantly more efficient, and if they actually hit that target of same range, eleven knots, and only four times the fuel they will have done well.
July 30th, 2013 at 12:33 am
[…] FPB 78: Calculating Fuel Burn & Range Under Power […]