
We have just finished a first look at the FPB 97-1 sea trials and two passages worth of data. What can be done on board this 110-foot 100 ton yacht, with just 600 HP
(the wide open throttle power available from a pair of John Deere 6068 diesels) may surprise a few people. Equally compelling is the real world data on the electricity available from the solar array.
FPB 97-1 has a comprehensive Maretron N2K monitoring system, with a black box that captures everything on the N2K backbone. This includes engine, genset and navigation data as well as temperature of pumps, fridge status, and bilge pump cycles – over 100 channels of information. We can then sort the data in spreadsheet form. It is a wonderful troubleshooting, maintenance, and systems design analysis tool.
One of the first items we are always interested in is the surfing characteristics of a new design, as this is a key heavy weather tactic (as well as being great fun). With a bit of wind and wave aft, it is normal for FPBs to accelerate smoothly down the faces of the waves. Steering and stability are enhanced, speed goes up, and mileage gets better. FPB 97-1 has yet to find a long ocean swell to ride, but the data below will give a hint of her potential. Information is extracted from a four and a half-hour period at two second intervals. Engines are turning a steady 2200 RPM.
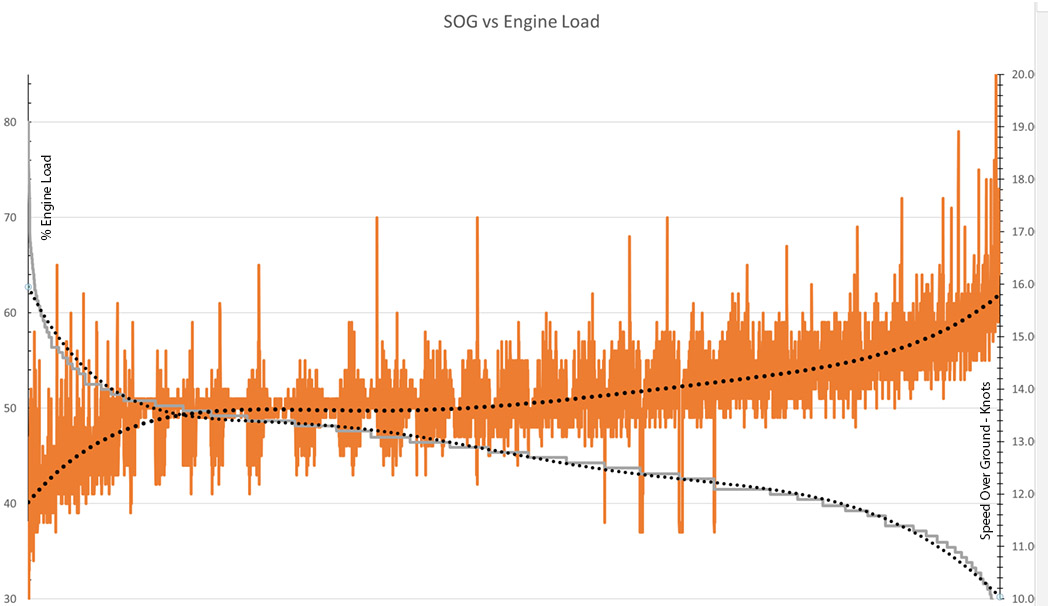
For the graph above, we sorted the data for speed, to isolate surfing from the steady state numbers, and compared it to engine load percentage. Notice how the engine load trend line is inverse with surfing speed. The faster the surf the lower the average engine load. There is quite a bit of data scatter between highs and lows, which is to be expected when surfing. The trend lines (dark larger dots for speed, smaller dots for engine load) help to illustrate the average trends in speed and engine load. For example, at 15 knots engine load is down to 37%.

Here we are looking at nautical miles per US gallon vs. surfing speed. As speed goes up with surfing, mileage and range increase as well. FPB 97-1 is averaging .85 nautical miles per gallon during this period, with a standard deviation of .15NM/G. This is at an average speed of 12.9 knots with a standard deviation of 1.51 knots. The fuel consumption rate includes hydraulic and electrical loads, as well as the induced drags from rudders and stabilizers working to keep the boat on course and upright. These non-propulsion related items represent between 10 and 15% of the total load.
Comparing this to 2200 RPM in smooth water, we find roughly the same fuel burn and mileage, but this is without the above mentioned loads and drags, and at a 1/2 to 3/4 knot slower speed. The net improvement from surfing allowing for increased speed is on the order of 15 to 20%.
There are many variables involved in surfing, but the one constant is displacement; lighter equals faster, longer surfs. With the FPBs, you will often find that increasing RPMs a touch and staying on the face of the wave for longer periods brings even faster speed and better mileage. It pays in terms of comfort and performance to plan your passaging to take advantage of weather that affords surfing conditions.
Surfing and safety may seem like an oxymoron to many when it comes to ocean crossing on a motor yacht, but it is an important part of the FPB arsenal of heavy weather tactics. Surfing allows you to get away from certain undesirable weather scenarios, particularly tropical storms. The alternative is jogging in place. This is the normal motor yacht tactic in big seas, which leaves you vulnerable to the oncoming blow.
Safe, comfortable, fast surfing comes down to steering control. And steering control in big seas is the result of:
- Moderate beam
- Balanced hull lines
- Large rudder(s)
- Fast acting autopilots
- Large range of positive stability
From the N2K data we can interrogate rudder angle and course over ground to evaluate steering control. With the seas on the quarter, FPB 97-1 Iceberg’s average course over ground was 289 degrees true. The standard deviation from the course was four degrees. The average rudder deflection was one degree, and the standard deviation for rudder angle was five degrees. Given the sea state and direction, it would have been more comfortable on board to reduce auto pilot gain and allow Iceberg’s course to wander a bit more, using less rudder input.
Now let’s look at roll. The average roll during this data period was .68 degrees with a standard deviation of 2.1 degrees. (Note that this minimal roll was before the stabilizer system was tuned by Naiad’s Dick McGrew, after which it performed better.)
We have been designing surfing capability into our yachts for 35+ years, and the FPBs are no different than their sailing cousins this regard. What we know from many hundreds of thousands of ocean crossing miles is that with good steering control, in most conditions the faster you go downhill, the more stable and comfortable the ride.
What is the FPB 97 capable of for short bursts, heading down a good sized open ocean wave? We will let you speculate, keeping in mind that the 83-foot FPB prototype Wind Horse regularly hit speeds in the high teens with a peak surf of 24.5 knots. FPB 64 Grey Wolf caught an eastern Atlantic wave for a ride of 22 knots. The best speed to date in any of our designs is the 78’ ketch Beowulf, running her easting down toward French Polynesia from New Zealand in a southwesterly compression gale…peak boat speed of 32.4 knots. The highest we have seen from FPB 97-1 Iceberg so far is 19.2 knots, and she is just getting started.
Next, let’s look at the wide open throttle data. WOT results are very much a function of the environment. Current, wind, water depth, and seas all have a large impact, and really accurate data is hard to come by. We have yet to experience optimum conditions. Still, this is an early indicator of potential.
We have two separate runs to evaluate. On December 5th, SOG was averaged in two directions at 14.55 knots, turning 2650 RPM with 93.5% engine load. In this instance there were 9,640 liters of water and fuel aboard. The VPP analysis predicted 14.75 knots at this engine loading, so we are off by 1.7%.
Another set of WOT runs were made on January 6th, this time with 10,640 liters of liquids aboard. These runs were done with more prop loading (thicker interceptor strips on the Veem propellers), in 17 knots of breeze on the beam, and a commensurate wind wave. Speed over ground was 14.7 knots (14.9 speed through the water) with 100% engine loading.
This wide open throttle data is most important to confirm our drag calculations for future design work and for optimizing propellers.
The next data is at cruising speed. During sea trials, with FPB 97-1 in light cruising trim, i.e. with 12,000 to 15,000 liters of liquid on board, the crew found a sweet spot around 2200 RPM and 12.25 to 12.5 knots. With the engines rated M5, 300HP at 2600 RPM, engine load averaged 52% with combined fuel burn at 57 liters/14.5 US gallons per hour. Dropping back to 1900 RPM and 11.5 knots reduced fuel burn to 35 liters/9.2 gallons per hour.
If you wanted the best performance, with sufficient fuel for a regional season, the previous paragraph would be in the ballpark. But let’s look at the opposite extreme: FPB 97-1 with both fuel and water tanks filled (over 8000 US gallons/30,000 liters of liquids), along with an extensive inventory of supplies and gear.
The data that follows is the average of a 1200 NM passage, with a variety of sea, wind, and current conditions. Sea state averaged between two and three meters, typically on the beam but occasionally forward. Keep in mind that this data includes all of the electrical and hydraulic loads as well as propulsion:
- RPM – 1938
- Speed Over Ground – 11.2 knots
- Engine load – 59% (with the engines de-rated to M3 at 235HP)
- Fuel burn – 51.4 liters/13.6 US gallons per hour
At the end of the passage, RPMs were increased and having burned off a quarter of the fuel, with relatively calm conditions, the performance picked up a bit:
- RPM – 2100
- Speed Over Ground – 13.15 knots
- Fuel burn – 64.2 liters/17 US gallons per hour
On a second long passage, this time with 25 to 35 knots of wind from the beam and forward quarter, with varying sea states, commensurate with wind driven waves and swell from other directions (fairly common washing machine sea-state), Iceberg again covered 1200 nautical miles, this time at an average speed of 11.8 knots at 2000 RPM, while consuming just a touch under 60 liters /15.8 US gallons per hour.
In terms of ultimate range under power on a long passage, given 24,600 liters/6400 US gallons of fuel capacity, with a cruising speed of 11.5-11.75 knots, a range of 4500 to 5000 NM is a realistic target. This assumes polished props, a clean bottom, starting off with minimum water, and reasonable weather. Range can be increased, of course, by dropping the speed a touch.
Which brings us to the solar array.

The FPB 97 Iceberg has 20 of the most efficient commercially available solar panels as of two years ago (even more powerful panels are being used on the FPB 78s). We know anecdotally that during the time FPB 97-1 was at the dock as she was being completed, the panels could supply all the power needed aboard.

Mark Fritzer snapped this photo of the solar array really pumping..

Peak output measured 238 amps at 26.25 volts, for a total of 6247 watts. Note that these are net values, measured after losses from MPPT controllers and wiring runs.
This happened to be in nice weather. What happens when conditions are not perfect?
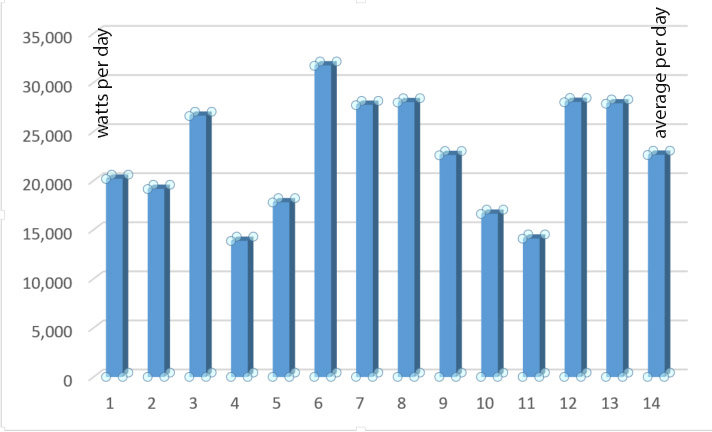
Here is a graph of the output averaged over a two week period the last week of December/first week of January. The good days were 25 to 31 kilowatts of total output. Average for the two weeks was 22.8kW per day, while the weakest days were all better than 13 kW.
FPB 97-1 is back in New Zealand, and we’ll have a chance to complete our testing and analyze the historical details further in the next few weeks. We will report more in due course.
Posted by Steve Dashew (April 20, 2015)
April 20th, 2015 at 7:41 pm
The amount of research and analysis you guys do is awesome, keep up the good work!
April 23rd, 2015 at 8:18 am
Thanks Andrew – We are just trying to build the perfect cruising yacht.
April 21st, 2015 at 1:39 am
You guys have designed some awesome boats. I think they would be perfect for Alaska’s coast do you think the 97 would survive a storm in the gulf of Alaska or the bearing sea. I’d like to be on board if anyone ever tries.
April 23rd, 2015 at 8:24 am
Hi Grant:
It would be much better to use the capabilities of the FPB to stay out of harms way. A survival storm in the Gulf or Bering Sea? That is too broad a question. Depends on whose definition of survival storm, sea state,crossing or breaking seas, wave shape, etc. What I am confident in is that it would do fine in anything we have seen in several hundred thousand sea miles.
April 23rd, 2015 at 4:40 am
Steve, I am trying to grasp the first plot, somehow I still don’t get it. What do you mean speed data points plotted by speed, is it speed points plotted for given engine loading percentage “bucket”? And solar production data is encouraging, nice production. Though I must comment the unit for energy must be watthours instead of watts. No need for running genset much I presume?
April 23rd, 2015 at 8:38 am
Hi Andy:
The speed trend line starts high on the right and ends low left. Engine load plot begins low right and ends high on the left side. Take any position across the graph and then read the speed and engine load at that speed on a vertical axis.You read speed on the right vertical axis and % engine load on the left. For example, at the extreme left boat speed is shown as 12 on the average line and engine % load as63%. At the extreme right side, boat speed is 15.8 knots and engine % load is 30%.
April 23rd, 2015 at 11:21 pm
Steve, this I get, but do I read it that extreme right with 30% load speed spread is varying 15.2kts to 20.0kts (ie. surfing pretty fast)?
April 26th, 2015 at 5:39 pm
Surfing, yes. Fast is relative. On a good day, with a long major ocean swell system….. maybe we will find out some day.
April 24th, 2015 at 10:59 pm
I might be having a bad hair day But maybe your graph should be gallons per nautical mile
eg .53 gallons/nm for 10 knots rising to .85g/nm at 12.9knts